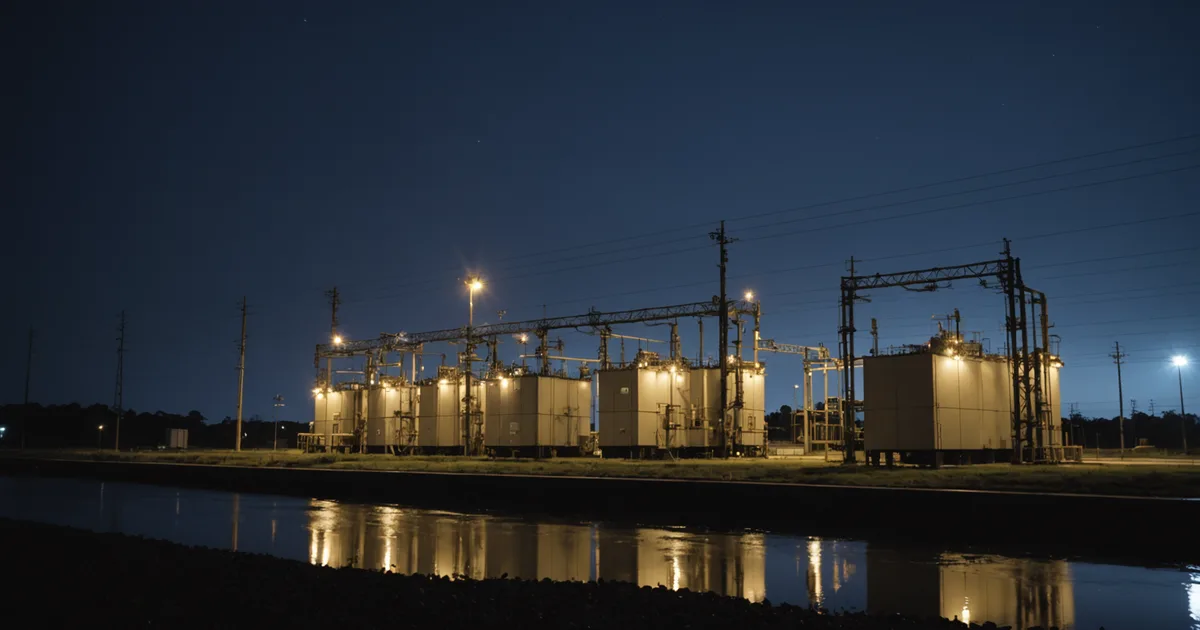
A tripped substation is a failure mode, not a surprise. By the time a feeder protection system trips, the load condition that caused it has been developing for hours. The question is whether your operations team had enough lead time to see it coming and do something about it. At the distribution level, 4-hour ahead forecasting at the feeder level is the timeframe that gives operators meaningful options.
Why 4 hours is the critical horizon
The options available to a distribution operator to prevent an overload depend entirely on lead time. At 15 minutes, you can manually shed load or activate interruptible service contracts. At 1 hour, you can activate demand response, redistribute load via switching, or alert field crews. At 4 hours, you have all of those options plus the ability to reposition mobile generation assets, coordinate with transmission, and notify affected customers with enough lead time to be useful.
The step change in available responses happens somewhere between 1 and 2 hours. Four hours is the target because it reliably falls on the useful side of that step change, gives enough buffer for demand response activation confirmation, and is still close enough in time for the forecast to be accurate enough to act on.
What accurate means at 4 hours
For a 4-hour ahead forecast to be useful for overload prevention, it needs to be accurate enough to distinguish between a feeder that will stay within safe limits and one that will approach or exceed them. The practical requirement is mean absolute percentage error below 8 percent on an hourly basis at the feeder level.
Substation-level forecasting does not meet this requirement reliably enough to support individual feeder management decisions. The averaging effect that makes substation forecasts look accurate hides the feeder-level variance where overloads actually originate. A substation forecast that is 5 percent accurate might have individual feeders that are 15 to 20 percent off in opposite directions, and those errors cancel at the aggregate level but matter operationally.
The role of weather in the 4-hour window
Weather is the dominant driver of forecast uncertainty at the 4-hour horizon, particularly for distribution systems with meaningful EV penetration or HVAC-driven loads. NWP model errors at 4 hours are much lower than at 24 hours, which is part of why 4-hour ahead forecasting is achievable at high accuracy even with weather-sensitive loads.
The specific challenge for Colorado and similar Western markets is convective storm activity in the afternoon summer hours. An afternoon storm that reduces temperatures by 10 to 15 degrees and cuts solar generation sharply changes the load profile in ways that a static forecast model does not handle well. Ampgrove's models incorporate real-time NWP updates and have been trained specifically on Colorado's convective weather patterns.
Building operator confidence in forecast-based response
Operators will not act on a forecast they do not trust. The path to forecast-based overload prevention is not installing a system that generates alerts. It is demonstrating, over 60 to 90 days of shadow operation, that the forecast is accurate enough to trust. When operators see the model calling near-overload conditions 4 hours ahead, and then watching those conditions actually develop, confidence builds. The response then becomes the natural next step.
What happens when you catch an overload early
The operational difference between catching an overload 4 hours out versus catching it at 45 minutes changes the available response set dramatically. At 45 minutes, most switching operations are still available, but mobile generation repositioning is not. Demand response notification may be too late depending on program terms. Customer notification is too late to be useful. The dispatch options narrow to reactive switching and emergency load shedding, both of which carry customer impact.
At 4 hours, the operator can stage a response: notify field crews of a potential switching operation, pre-position mobile generation if available, issue demand response pre-notification to eligible customers, and schedule the switching operation to execute at the optimal time. None of these actions are irreversible. If the forecast condition does not develop, the staged response can be stood down without customer impact. This flexibility is what makes 4-hour ahead forecasting operationally transformative rather than just incrementally useful.
Integration with NERC reliability standards
Distribution operators who are not directly subject to NERC reliability standards often have less formalized event documentation requirements than transmission operators. That does not mean event documentation is less important. Near-overload events that were addressed proactively through forecast-based dispatch represent exactly the kind of reliability action that utilities want to have documented for rate case and reliability reporting purposes.
Ampgrove maintains an audit trail of all forecast conditions that triggered dispatch recommendations and the operator actions taken in response. This record documents the reliability value delivered in a form that is useful for both internal reporting and regulatory proceedings. Utilities that have been operating under pressure from state commissions about distribution reliability can demonstrate a concrete forecast-based intervention program with quantified near-miss prevention events.
Feeder-specific overload risk profiles
Not all feeders have equal overload risk, and not all overload risk is weather-driven. Some feeders are capacity-constrained by physical infrastructure and approach rated limits regularly during peak periods regardless of weather. Others face risk primarily from weather-sensitive loads or concentrated EV charging clusters. Identifying which feeders face which type of risk is part of the initial feeder profiling work we do at the start of every pilot deployment.
Understanding the risk profile of each feeder allows operators to focus attention appropriately. A feeder that regularly runs at 85 percent of rated capacity during summer peaks needs different operating attention than a feeder that runs at 50 percent except during extreme cold snaps. Ampgrove's dashboard surfaces feeder risk profiles explicitly, so operators can identify which feeders warrant proactive monitoring during any given weather event and which can be handled with standard monitoring procedures.
For utilities managing 50 to 150 feeders, this kind of prioritized risk view is what makes the difference between a monitoring system that overwhelms operators with undifferentiated information and one that focuses attention where it is needed. The goal is not to show operators everything happening on the grid at once. It is to show them what requires a decision in the next 4 hours, ranked by urgency and supplied with a recommended action.